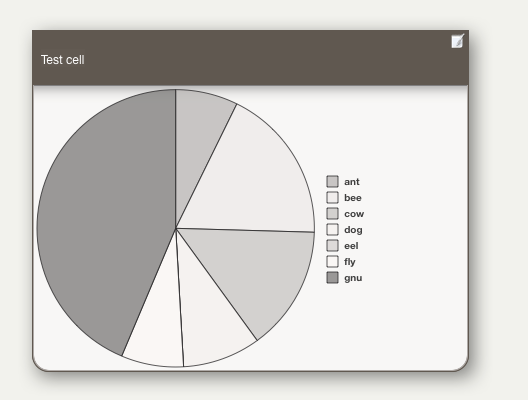
Note that this pattern cannot be set via the Interior Inspector, use the Plot Inspector. The pattern requires configuration via its parameters. This pattern can be used in shaped notes.
The pie() plot can be used in normal map note icons including shaped notes. Originally, this pattern was only available for use in container plots.
pie( $ValuesSource )
The graph is drawn in the form of a pie graph of the container's immediate children. ValueSource can be an attribute, or an expression yielding a number, reflecting the container's children. Thus:
pie($EditsMade)
will plot $EditsMade for each child in $OutlineOrder plotting anti-clockwise from the 90-degree position.
If using an non-outline order related attribute for $ValuesSource, consider either showing it as a $TableExpression or sorting the plot's container on $ValuesSource.
For non-container use of the pattern, pie() uses the additional arguments, Min and Max. Min defaults to 0 and Max to 100. If only one range limit is provided the other is used at default value. Thus:
pie(65,0,100)
plots a 65% competed circle. The pie plots as a circular progress bar, anti-clockwise from the 90-degree position.
Other aspects of the pattern's display:
- Labels are drawn atop pie chart segments (avoiding other other segments overlying each others labels).
- The colours for each segment of the pie chart are taken from the attribute $PlotColorList (default list value: "2;7;3;8;4;9;0;5;1;6", using system numbered colours). The first colour designates the colour of the first segment, and remaining colours in the list are used in rotation until all segments have been drawn. If the list contains fewer than two colours, "black;white" are used inside.
- If the container is sufficiently wide, a legend is drawn to the right of the pie chart. Otherwise, pie segments are labeled in the pie chart (where the slice is big enough to fit a label) smaller slices are left unlabelled.
- If $Direction is false ( the default), the first segment begins at the top of the pie (0º) and subsequent segments are added clockwise, as is customary in geography. If $Direction is set to true, the first segment begins at the right edge of the circle (90º) and segments are added counter-clockwise, as customary in mathematics.
- Pie segments are separated by a dark grey line.
- If a container or agent has a pie chart, then the alias of that container or agent will also display the same pie chart, if space allows.
The pie() plot does not use the 'target' value of other container plots.
