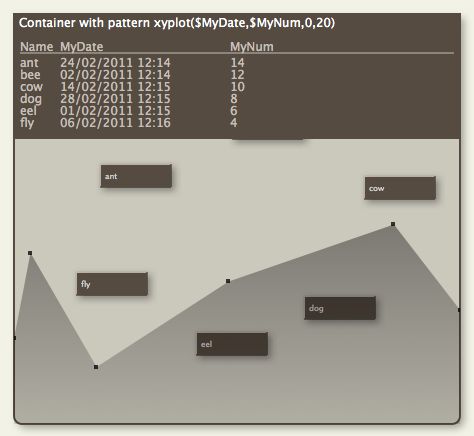
Note that this pattern cannot be set via the Interior Inspector - use the Plot Inspector. The pattern requires configuration via its parameters. This pattern can be used in shaped notes. This pattern is only available for use in container plots and has no visual effect if applied to other objects.
xyplot( $XValuesSource, $YValuesSource [,yMin][,yMax[,Target] )
The graph is drawn in the form of a Cartesian graph of the container's immediate children. $XValuesSource and $YValuesSource are expressions, evaluated in turn of each child and are normally attribute values in the simplest forma of use. Thus:
xyplot($Date,$Price)
will plot $Date (ascending Date type order) on the X-axis of the container plot and $Price (ascending Number data type) on the Y-axis.
By comparison with plot():
plot($Price)
is equivalent to
xyplot($SiblingOrder,$Price)
Thus if using an non-outline order related attribute for xValuesSource, consider either showing $XValuesSource and $YValuesSource as a $TableExpression or sorting the plot's container on $XValuesSource.
Optionally, a yMin and/or a yMax may be specified to lessen expansion of the Y-axis; otherwise, the Y-axis plots from the lowest value of $YValuesSource for the container's child notes, to the highest value. The X-axis automatically starts at the lowest $XValueSource and runs to the highest $XValueSource.
The target represents a nominal or desired result. For example, if normally writing between 0 and 4000 words on any given day, it might be useful to set a target at 1500 words/day. If setting a target, a min and max must also be set.
Alternate container plots are: bargraph() and plot().
The background of the plot is set via $PlotBackgroundColor with opacity of $PlotBackgroundOpacity.
